BBB Permeability: Difference between revisions
No edit summary |
m Fixed broken links |
||
| Line 45: | Line 45: | ||
<div class="mw-collapsible-content"> | <div class="mw-collapsible-content"> | ||
Only a short summary of main technical aspects of BBB penetration predictors is given here. For a more detailed description of the modeling approach and underlying theory please refer to Lanevskij, K. et al. ''J Pharm Sci.'' '''2009''';98(1):122-34. [ | Only a short summary of main technical aspects of BBB penetration predictors is given here. For a more detailed description of the modeling approach and underlying theory please refer to Lanevskij, K. et al. ''J Pharm Sci.'' '''2009''';98(1):122-34. [https://pubmed.ncbi.nlm.nih.gov/18481317] | ||
===Calculated quantitative parameters=== | ===Calculated quantitative parameters=== | ||
Revision as of 11:58, 14 October 2022
Overview
BBB module provides a comprehensive evaluation of blood-brain barrier penetration potential of drugs and drug-like compounds in rodents. Each compound of interest is given an estimate whether it would be permeable enough to exhibit CNS activity. Qualitative classification is based on reliable and theoretically reasonable predictions of the rate and extent of BBB permeation (expressed as LogPS and LogBB constants respectively) governed by passive diffusion. Predictions performed by this module may serve as an initial screen that allows ranking of compounds according to their blood-brain transport characteristics. It also enables the user to simulate the effect of changing main physicochemical parameters of the compound on its brain disposition.
Features
- Provides a unified interface that summarizes all relevant information regarding BBB penetration potential of the compound of interest
- Classifies the compound as CNS permeable on non-permeable and displays the values of quantitative parameters supporting the prediction:
- Rate of brain penetration (LogPS)
- Extent of brain penetration (LogBB)
- Brain/plasma equilibration rate (Log (PS * fu, brain))
- Visualizes the predictions using the 'traffic lights' scheme showing which parameters preclude brain delivery of the analyzed compound
- Allows altering the values of main physicochemical determinants to get an insight on structural changes needed to achieve desired permeation characteristics
- Displays a scatter plot providing a possibility to compare relevant brain penetration characteristics of the analyzed compound to a set of well-known CNS and peripheral drugs.
- Displays carrier-mediated transport alerts for compounds that undergo facilitated diffusion or active efflux across BBB
Interface
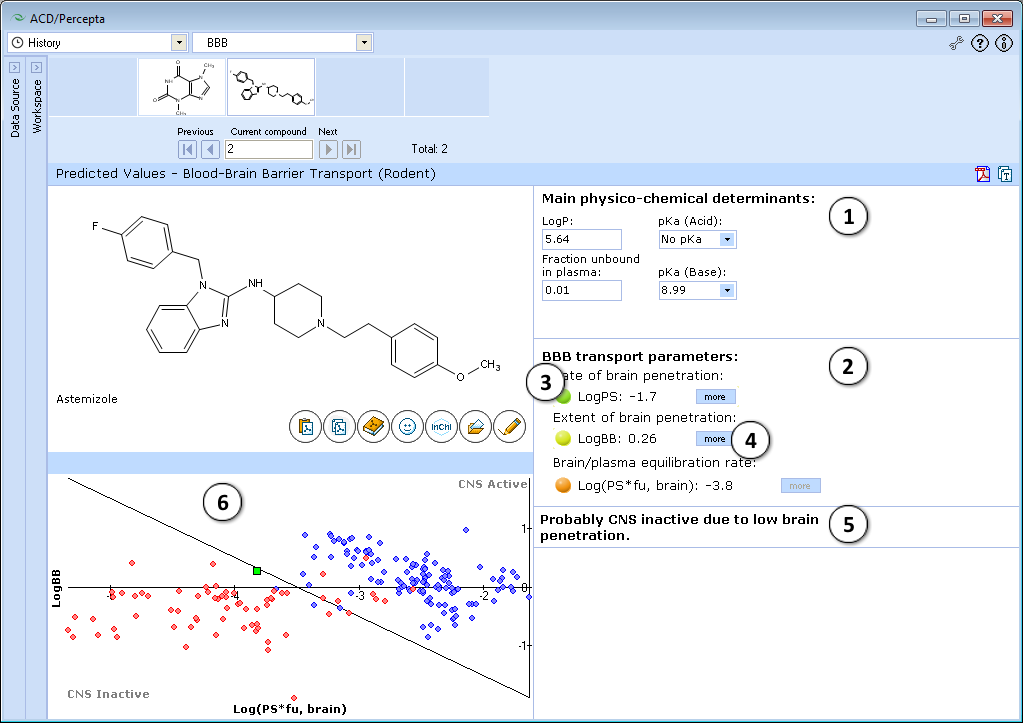
- Main physicochemical descriptors (logP, pKa, and the extent of plasma protein binding) are calculated automatically. Enter experimental values to improve prediction accuracy, or type custom values to model the influence of the respective properties on brain disposition of the compound of interest.
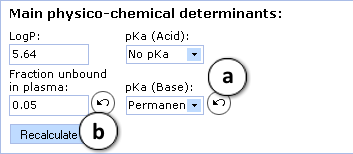
- a. Click the "Undo" button to reverse the manually entered property value to the automatically calculated value (Fraction unbound in plasma and pKa (Base) in this picture) for a compound and to recalculate the Blood-Brain Barrier permeability
- b. Click to recalculate the unbound fraction in brain and LogBB using the currently specified parameter values
- Calculated values of LogPS, LogBB, and Log (PS * fu, brain):
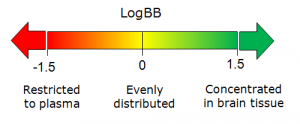
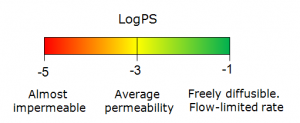
- 'Traffic lights' highlight which properties of the compound are favorable (green), suitable (yellow), or problematic (red) for penetrating into CNS
- Click "more" to switch to LogPS or LogBB module to receive more information regarding the calculation of the particular property
- Final qualitative estimate indicating whether the compound would be sufficiently permeable to exhibit CNS activity
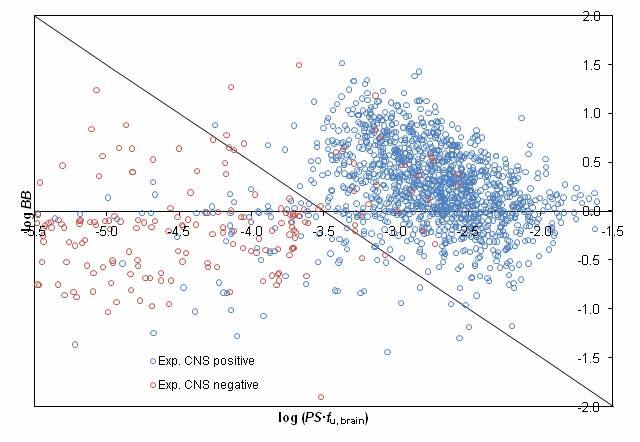
- CNS activity plot presents for several hundreds of known CNS-penetrating (blue points) and peripherally acting (red points) drugs. The green point denotes the currently analyzed molecule. Hover over a data point to see the corresponding compound's name, structure, as well as predicted values of brain/plasma equilibration rate and extent of brain delivery at equilibrium.
Technical information
Only a short summary of main technical aspects of BBB penetration predictors is given here. For a more detailed description of the modeling approach and underlying theory please refer to Lanevskij, K. et al. J Pharm Sci. 2009;98(1):122-34. [1]
Calculated quantitative parameters
BBB module calculates the following quantitative characteristics of drug transport across blood-brain barrier:
Main parameters:
- Rate of brain penetration (Log PS). PS stands for Permeability-Surface area product and is defined from the kinetic equation of capillary transport (PS = -F * (1 - e-Kin/F)). By Its physical meaning PS is equal to the influx rate constant Kin corrected for blood flow rate in cerebral microcapillaries denoted as F.
- Extent of brain penetration (Log BB) determined by ratio of total drug concentrations in tissue and plasma at steady-state conditions (log BB = log(cbrainSS/cbloodSS).
Additional parameters:
- Fraction unbound in brain tissue (fu, brain)
- Brain/plasma equilibration rate given by log (PS * fu, brain) - combination of permeation rate and fraction unbound in brain.
When only single parameter values are considered fu, brain provides a better insight on drug disposition in CNS than Log BB since the former provides a direct estimate of tissue binding affinity/free (pharmacologically active) drug levels in brain, while the latter represents a superposition of compounds' binding to brain lipids and plasma proteins. However, both equilibrium distribution ratio (Log BB) and the rate of achieving this equilibrium (defined as log (PS * fu, brain) according to Liu X. et al. J Pharmacol Exp Ther. 2005;313(3):1254-62. [2]) must be evaluated to estimate whether enough compound permeates through BBB to reach pharmacologically active levels in brain.
Experimental data
The data sets used for modeling were compiled from original literature publications of BBB permeation studies in rodents. Quantitative log PS data were collected for more than 250 compounds. These were determined by one of the following experimental methods:
- Intravenous administration (IV)
- Brain uptake index (BUI)
- In situ brain perfusion.
Analysis of published brain/plasma distribution studies of drugs after intravenous (in some cases – intraperitoneal or oral) administration to rats and mice yielded a data set of log BB values for about 600 compounds. The collected data were thoroughly evaluated to ensure that they represent BBB transport by passive diffusion. The resulting data sets after preliminary analysis contained almost 200 log PS constants and almost 500 log BB ratios.
Modeling method & used descriptors
The predictive models of log PS and log BB constants were built using non-linear least squares regression. Non-linear fitting was necessary to account for the following aspects of the analyzed processes:
- Differentiation between diffusion-limited and cerebral blood flow-limited permeability (LogPS).
- Bilinear permeability - LogP dependence: rise of permeability with LogP up to a certain optimum point followed by subsequent decrease due to hydrophobic retention in the membrane (LogPS).
- Ionization-specific partitioning of electrolytes between phospolipid bilayer and plasma (LogPS) or brain tissue lipids and intesrtitial fluid (LogBB).
In both cases fitting was performed in a multi-step approach: the first stage involved determination of parameters describing membrane/plasma partitioning of neutral molecules while in the second stage stage these values wre fixed and eletrolyte-specific passive transport parameters were obtained.
Descriptors used for modeling included key physicochemical properties - octanol/water LogP of neutral species as a determinant of lipophilicity, ion form fractions at pH 7.4 calculated from the respective pKa values, number of hydrogen bond donors and acceptors in the molecule, and McGowan characetristic volume reflecting molecular size. All physicochemical property values were calculated with Algorithm Builder 1.8.
Prediction accuracy
Prior to development of both log PS and log BB predictive models a part of each data set was reserved for validation purposes and not used in modeling (internal validation set). Additionally, two independent data sets representing another type of experimental data (directly measured fu, brain values) were extracted from recent publications (Kalvass J. C. et al. Drug Metab Dispos. 2007;35(4):660-6 [3], and Summerfield S. G. et al. Xenobiotica. 2008;38(12):1518-35. [4]) These were used as external validation sets to confirm intrinsic correctness of the obtained model.
Performance of the models on various validation sets is presented in the table below:
| Data set | N | R2 | RMSE |
|---|---|---|---|
| log PS internal validation set | 53 | 0.82 | 0.49 |
| log fu, brain internal validation set | 137 | 0.74 | 0.41 |
| log fu, brain external validation set (Kalvass et al., 2007) | 31 | 0.73 | 0.42 |
| log fu, brain external validation set (Summerfield et al., 2008) | 20 | 0.70 | 0.36 |
Statistical parameters obtained for internal and external test sets demonstrate good predictive power of the models with RMSE being close to error of experimental determination in both cases.
The proposed classification scheme was validated using experimentally assigned CNS activity categories for more than 1500 compounds presented in the study by Adenot M. & Lahana R. J Chem Inf Comput Sci. 2004;44(1):239-48. [5] After removing compounds, disposition of which is affected by P-gp efflux 92% of the remaining molecules were correctly classified by our model as shown in the figure below:
Transport mechanisms
The predictive models comprising the BBB module only account for passive transport of analyzed compounds across blood-brain barrier. In order to propose a clear physicochemical explanation of passive diffusion process, the data used for development of both LogPS and LogBB models were thoroughly evaluated to exclude values affected by enzymatic efflux or influx. For such compounds special alerts are displayed in all submodules related to the prediction of BBB transport parameters indicating that observed parameters for these molecules may be higher or lower than predicted values due to presence of carrier-mediated processes, such as facilitated diffusion or P-gp efflux. Considered influx transporters include:
- Amino-acid transport systems (System A, L, y+, x-)
- Glucose carrier GLUT1
- Organic cation/carnitine transporters (OCTN)
- Organic anion transporting polypeptide (OATP)
- Various other carriers specific for nucleotides and other endogenous substances.