pH Selector
Introduction
ACD/pH Selector for LC is a utility that allows you to find optimal pH ranges for your separation. Depending on pH of mobile phase the compounds to be separated can go from one ionic form into another. These ionic forms differ by hydrophobicity therefore pH of mobile phase can often influence on selectivity and resolution of peaks. On the other hand, the pH of mobile phase (at which two or more ionic forms in comparable concentration can coexist) may lead to increase in peaks width and asymmetry.
ACD/pH Selector for LC is based on the LogD profile of the analytes. It looks into the change in aqueous/organic distribution of ionized as well as unionized forms of all the target analytes as a function of pH and relates it to eluent/stationary phase partition of analytes in RPLC. It shows the suitable (green) or forbidden (red) zone based on the specified limits of the minor ionic forms from all the analytes as well as pH-range limits of the selected LC columns.
Interface
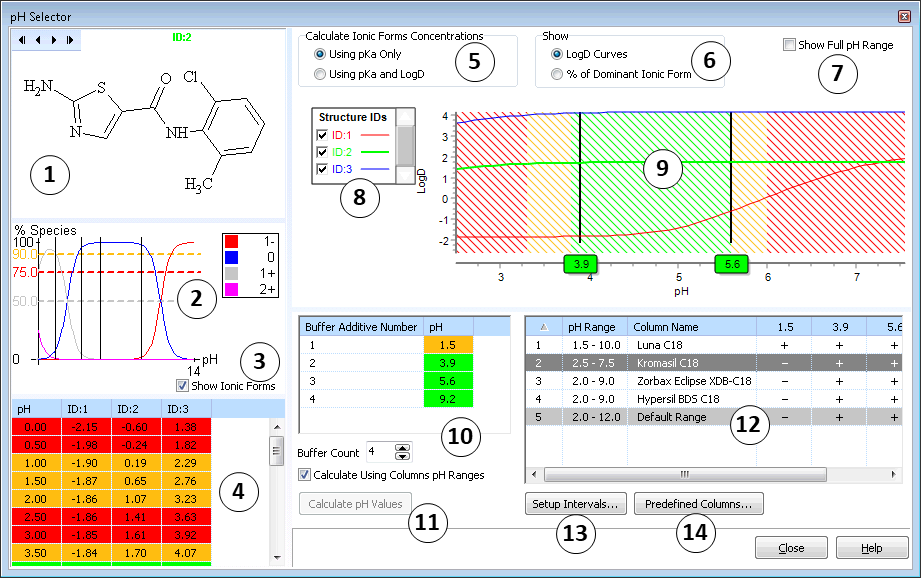
The dialog box contains the following elements:
- Structure: In this area, you can view chemical structures visible in the active project. To switch between chemical structures, use
 buttons located at the top in this area or, in the adjacent Structure IDs area, point to the required ID.
 - Ionic Forms: This area shows the shares of the ionic forms (in %) at specified pH values. To display/hide this area, use the Show Ionic Forms check box above.
- Show Ionic Forms: Select/clear this check box to display/hide the Ionic Forms area.
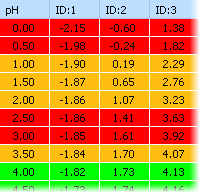
- pH-LogD: In this table, you can view the pH values from 0 to 14 and the corresponding LogD values of the chemical structures from the Structure IDs area.
- Calculate Ionic Forms Concentrations: In this area, select the required option to use only pKa or both pKa and LogD for calculation.
- Show: In this area, select the required option to display either LogD curves or % of dominant ionic forms below.
- Show Full pH Range: Select this check box to show full pH range (0–14) on the pH axis; clear it to show the pH range of the selected column or default pH range on the pH axis.
- Structure IDs: In this area, you can view the IDs of the chemical structures visible in the active project. The color corresponds to the color of the curve in the adjacent LogD Curves area. In this area, you can do the following:
- Point to the required ID and the corresponding structure is displayed in the Structure area.
- Click the check box adjacent to the required ID to display/hide the corresponding LogD curve in the LogD Curves area.
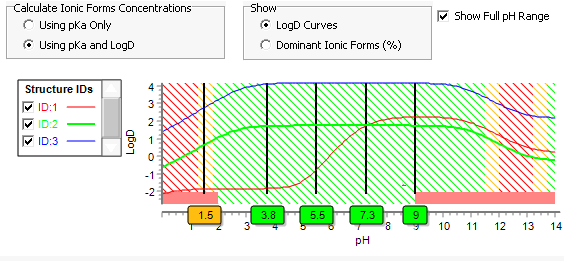
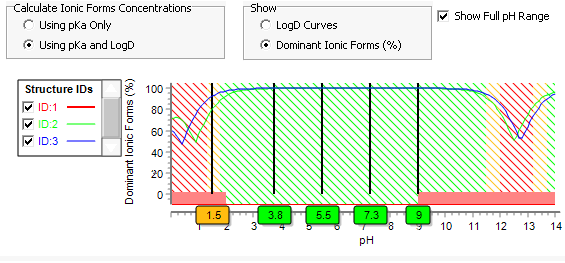
- LogD Curves/% of Dominant Ionic Forms: In this area, depending on the option selected in the Show area you can view:
- The LogD curves
- The percentage of dominant ionic forms
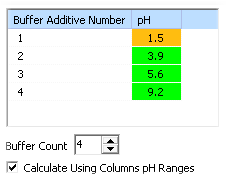
- Buffer Additive-pH: This table displays the pH values automatically selected by the program. Note that the number of rows corresponds to the number of available channels with buffer additives in the chromatograph.
- Calculate pH Values: Recalculates pH values in the table.
- Table of Columns: This table displays the list of columns and the pH ranges recommended for them. As you click the required column in the table, the plot in the LogD Curves area is changed accordingly. The + and – in the pH columns demonstrate whether it is possible to use a column at certain pH or not.
- Setup Intervals: Displays the Setup Intervals dialog box where you can define limits for maximum concentration of minor ionic forms.
- Predefined Columns: Displays the Predefined Columns Collection dialog box where you can select columns from predefined list. Note that the predefined columns cannot be edited.
pH-LogD table
In this table, you can view the pH values from 0 to 14 and the corresponding LogD values of the chemical structures from the Structure IDs area. By default, the green color denotes the most suitable pH values, the yellow – the acceptable ones, the red – unacceptable values. This coloration is the duplication of the vertical regions of the LogD Curves area to the upper right of the pH Selection window. To change the coloration scheme, click Setup Intervals to the right.
Right-clicking in the table displays the shortcut menu:
- Copy to Clipboard (Ctrl+C): Copies the selected rows of the table to the Clipboard. You can select the required rows by clicking them holding down SHIFT or CTRL on your keyboard or using the other commands on this shortcut menu.
- Select All (Ctrl+A): Selects all the table rows.
- Unselect All (Ctrl+U): Cancels the selection of all the table rows.
- Invert Selection (Ctrl+I): Cancels the selection of the currently selected rows and selects the unselected ones.
LogD Curves/% of Dominant Ionic Forms area
In this area, you can view:
The graphs are displayed for the compounds visible in the active project. You can view the ID of the structure in the adjacent Structure IDs area. The pH axis shows the pH range of the column from the Table of Columns or full pH range (0–14); to switch between the ranges use shortcut menu commands.
The shaded areas represent the suitable, acceptable, and prohibited pH areas. You can set the coloration scheme and intervals using Setup Intervals from the shortcut menu. Note that if LogD curves of your compounds show red-shaded areas at different pH values, on selecting several compounds several red-shaded areas may be visible in overlaid LogD curves.
If the columns are not selected in the Table of Columns or pH range is not specified, for all these columns the default range 2–12 will be automatically applied. The values in the boxes under the lines reflect the selected pH values.
The vertical lines correspond to pH values from the Buffer Additive-pH table below. You can drag the lines to the required location. The pH values in the Buffer Additive-pH table will be changed correspondingly.
To enlarge the required region, drag over it. To return to the whole view, double-click the enlarged area. You can also right-click within the enlarged area, and from the shortcut menu that appears, select Zoom Out.
Right-clicking within the area displays the shortcut menu containing the following commands:
- Zoom Out: Returns to the whole view in case the zoom tool was applied to the LogD Curves area.
- Copy to Clipboard: Copies the current contents of the Structure IDs and LogD Curves areas to the Clipboard.
- Setup Intervals: Displays the Setup Intervals dialog box where you can define limits for maximum concentration of minor ionic forms.
- ColumnName: Switches the plot to the pH range defined for a column in the Table of Columns below. The number of ColumnName commands corresponds to the number of non-default pH ranges displayed.
- Show Full Range: Switches the plot to the full pH range (0–14).
- Default Range: Switches the plot to the default pH range defined in the Table of Columns below.
Buffer Additive-pH table
This table displays the pH values automatically selected by the program. Note that the number of rows corresponds to the number of available channels with buffer additives in the chromatograph.
- In the Buffer Count box, you can edit the number of buffer additives in the table above. Note that the existing pH values are automatically recalculated if required.
- Select the Calculate Using Columns pH Ranges check box to use pH ranges specified in the Table of Columns for calculation; otherwise the default pH range is used.
Right-clicking in the table displays the shortcut menu:
- Add pH Buffer: Adds a new buffer to the table automatically recalculating the existing ones if required.
- Delete pH Buffer: Select the required pH cell by clicking it in the table, then right-click it and, from the shortcut menu that appears, choose this command to remove the value from the table automatically recalculating the existing pH values if required. You can also select the required cell and press DELETE to remove the value or use BACKSPACE to partially remove the value.
- Edit pH: Select the required pH cell by clicking it in the table, then right-click it and, from the shortcut menu that appears, choose this command to start editing. You can also select the required cell and press F2 or ENTER to start editing.
- Calculate pH Values: Automatically recalculates pH values.
Table of Columns
This table displays the list of columns and the pH ranges recommended for them. As you click the required column in the table, the plot in the LogD Curves area is changed accordingly. The + and – in the pH columns demonstrate whether it is possible to use a column at certain pH or not. To sort the contents of the table by the required parameter, click the corresponding table header.
Right-clicking in the table displays the shortcut menu:
- Select Columns: Displays the Predefined Columns Collection dialog box where you can select columns from predefined list.
- Add Column: Displays the Add Column dialog box where you can specify the required pH range and column name to be added to the table.
- Edit Column: Displays the Edit Column dialog box where you can edit the pH range and the name of the column selected in the table (except for the predefined columns). You can also double-click within the table to display this dialog box.
- Delete Column: Removes the selected column from the table.
Setup Intervals
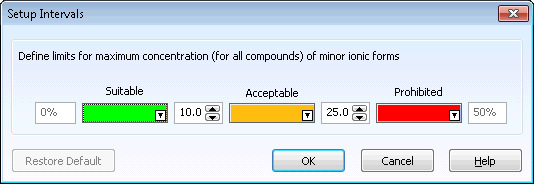
This dialog box allows you to define permissible impurity content criteria of the ionic forms. You can set coloration scheme and limits for maximum concentration of minor ionic forms.
To display this dialog box, right-click within the LogD Curves area of the pH Selection window and, from the shortcut menu that appears, choose Setup Intervals. You can also click Setup Intervals below in the pH Selection window.
To create a coloration scheme, in the Suitable, Acceptable and Prohibited boxes, choose the desired color from the palette that appears, and then, in the adjacent box, type the required values to set the concentration intervals.
To return to the default coloration scheme, click Restore Default below in the dialog box.
As you change the concentration intervals and coloration scheme, the program recalculates pH ranges and redraws the graph in the LogD Curves area immediately. Click OK to preserve the changes or click Cancel to discard them.
Predefined Columns Collection
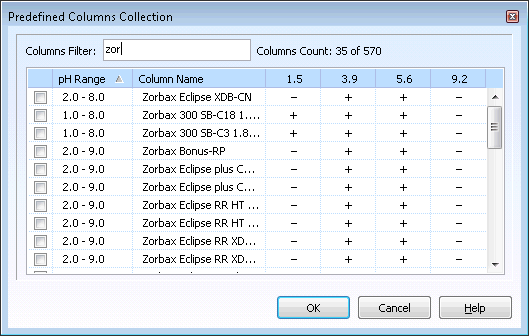
In this dialog box, you can select columns from predefined list.
To display this dialog box, right-click within the Table of Columns in the pH Selection window and, from the shortcut menu that appears, choose Select Columns or click Predefined Columns below the table.
The dialog box contains the following options:
- Columns Filter: In this box, type the search query and the program displays the columns that satisfy the query in the table below.
- Columns Count: Displays the total number of predefined columns in the table below. As you type a search query in the Columns Filter box, the number of found columns out of the total number of predefined columns is displayed (e.g., 8 of 570).
- Table of Columns: This table displays the list of predefined columns and the pH ranges recommended for them. The + and – in the pH columns demonstrate whether it is possible to use a column at certain pH or not.
Add/Edit Column
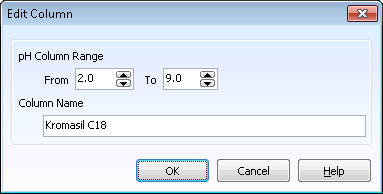
In the Add Column dialog box, you can specify the required pH range and column name to be added to the Table of Columns of the pH Selection window.
In the Edit Column dialog box, you can edit the pH range and the name of the column selected in the Table of Columns of the pH Selection window.
To display this dialog box, right-click within the Table of Columns in the pH Selection window and, from the shortcut menu that appears, choose Add Column or Edit Column. Note that in the latter case, you should select the column to be edited by clicking it prior to displaying the dialog box.
