PhysChem DB
Jump to navigation
Jump to search
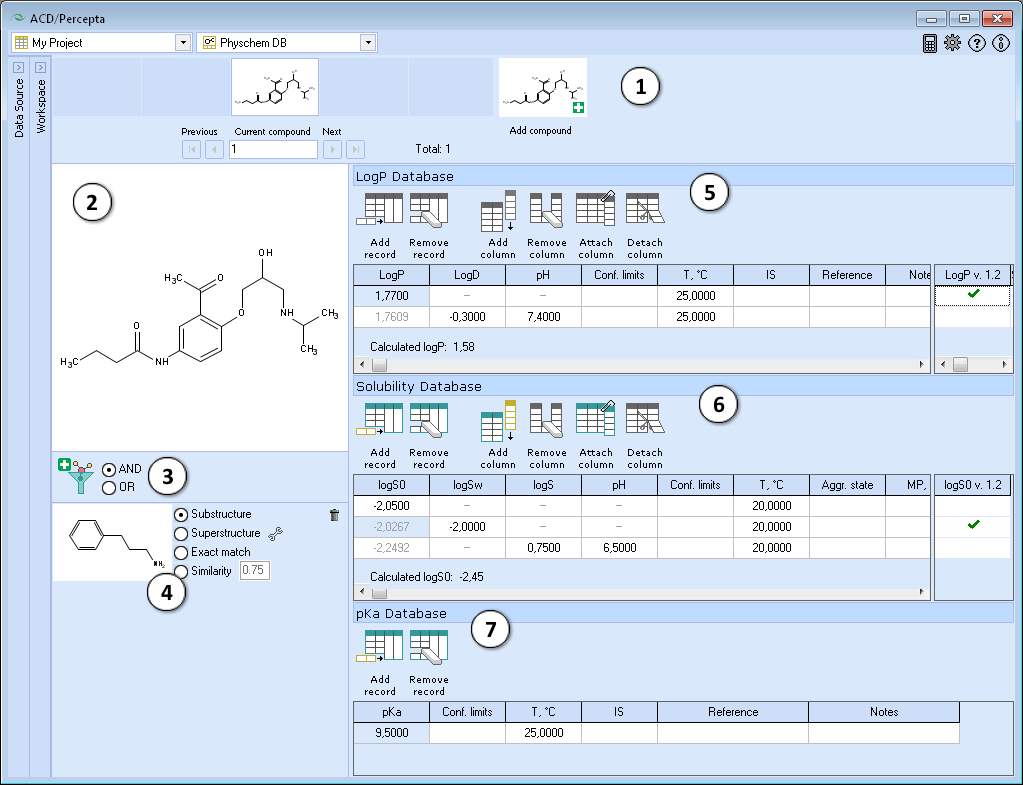
PhysChem DB is a special workspace in ACD/Percepta designed to faciliate the maintenance of the experimental databases and training the predictive algorithms of major physicochemical properties: LogP/LogD, pKa, and LogS. PhysChem DB workspace is organized similarly to the Single Record View, however, instead of dynamically populating the main view with all the fields found in the project, it displays a number of predefined panes with specific functionality dedicated to the particular physicochemical properties.

- Navigation Bar
The Navigation Bar appears in all workspaces except the Spreadsheet View. It displays presented structure and two previous as well as two next stuctures in the corresponding dataset. If no dataset is selected, the Navigation Bar displays the history of performed calculations.
When the compound outside of the dataset is used as an input structure for calculation, the user can add it to the current dataset:

- Click the
 pictogram to replace the current structure with the new one. All subsequent calculations will be performed automatically for the added compound.
 - Click the
 pictogram to add new compound to the current dataset. It will appear as the last record in the dataset and all subsequent calculations will be performed automatically.
 - The structure browse bar displays the active structure number and the total number of records in the current dataset. Scroll through the database using the browse buttons: First/Last record, Previous/Next record or pressing the up/down arrow keys on the keyboard to go to the next/previous record. Type a record number to view it directly.
- Click the
- Structure Pane
The Structure Pane displays a 2-D representation of the chemical structure of the currently selected compound.
Differently to the Prediction modules, the Structure Pane in the Single Record View does not display the structure editing toolbar. - Add a new structure filter and set the logical operator to combine multiple filter conditions if present.
- The interface for setting up the filter conditions is the same as in the Spreadsheet. Please refer to the Structure Filter section for more details.
- LogP Database roll-down pane. Provides a Multiple Entries editor for the group of fields related to LogP and LogD measurements:
- LogP - 1-octanol/water partitioning coefficient of neutral form
- LogD - pH-dependent 1-octanol/water partitioning coefficient
- pH of LogD measurements
- Conf. limits - confidence limits of determination
- T, oC - temperature, in degrees Celsius
- IS - ionic strength of the solution
- Reference - literature citation
- Notes - an additional field for user comments
The editor is designed to accept the input in terms of either LogP or LogD measured at given pH:

- If LogP value is entered, LogD and pH cells in that row are disabled.
- If both LogD and pH are entered, LogD is automatically recalculated to LogP of neutral form. The cells containing recalculated LogP become read-only and are displayed in gray color.
- The LogP value calculated using the ACD/LogP predictor with the current settings is shown below the table. The user input is compared against this prediction and a warning is displayed if the entered value significantly differs from the prediction. There is no warning if the difference is less than 1 log unit, the warning color is yellow if it is in the range of 1-2 log units, and red - if larger than 2 log units.
- The checkboxes on the right provide the possibility to include the entered data in the currently selected Self-training library for ACD/LogP GALAS module.
- Solubility Database roll-down pane. Provides a Multiple Entries editor for the group of fields related to the measurements of solubility in water and in buffer:
- LogS0 - intrinsic solubility in water
- LogSw - solubility of the compound in pure water
- LogS - solubility in buffer
- pH of LogS measurements
- Conf. limits - confidence limits of determination
- T, oC - temperature, in degrees Celsius
- Agg. state - aggregative state of the compound
- MP, oC - melting point, in degrees Celsius
- Reference - literature citation
- Notes - an additional field for user comments
The editor is designed to accept the input in terms of either LogS0, LogSw or LogS measured at given pH:

- If the intrinsic solubility of the compound (LogS0) value is entered, LogSw, LogS and pH cells in that row are disabled.
- If solubility in pure water (LogSw) is entered, LogS and pH cells in that row are disabled, and LogSw is automatically recalculated to produce intrinsic solubility.
- If both LogS and pH values are entered, LogSw cell is disabled and LogS is automatically recalculated to LogS0. The cells containing recalculated LogS0 become read-only and are displayed in gray color.
- The LogS0 value calculated using the ACD/LogS0 predictor with the current settings is shown below the table. The user input is compared against this prediction and a warning is displayed if the entered value significantly differs from the prediction. There is no warning if the difference is less than 1 log unit, the warning color is yellow if it is in the range of 1-2 log units, and red - if larger than 2 log units.
- The checkboxes on the right provide the possibility to include the entered data in the currently selected Self-training library for ACD/LogS0 GALAS module.
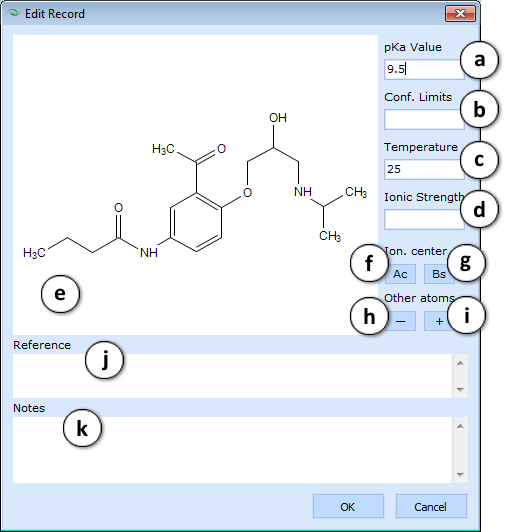
- pKa Database roll-down pane. Provides a Multiple Entries viewer and a special pKa record editor for the group of fields related to pKa measurements. Double click any table cell to bring up the editor window and populate the following fields:
- pKa value - measured acidic dissociation constant

- Conf. limits - confidence limits of pKa determination
- T, oC - temperature, in degrees Celsius
- IS - ionic strength of the solution
- The Structure Pane is interactive and allows you to assign the protonation state of the molecule and the dissociation stage described by the entered pKa value. The assignment process is controlled by the buttons listed below. Ionization center:
- Ac - press this button and then click on an atom, the loss of proton from which is characterized by given acid pKa value. The selected atom will be marked red.
- Bs - press this button and then click on an atom, the loss of proton from which is characterized by given base pKa value. The selected atom will be marked blue. Other atoms:
- + - press this button and then click on an atom to add a positive charge or to undo a previously set negative charge
- - - press this button and then click on an atom to add a negative charge or to undo a previously set positive charge
- Reference - literature citation
- Notes - an additional field for user comments
Note: Roll-down menus can be viewed simultaneously by dragging them partway up or down the pane.